
What a product LCA actually measures.
Someone has asked you for the footprint of a garment, and the answer is a single number with a unit after it. Almost everything interesting about that number happens before it is calculated: in what you decided to measure, how far along the product’s life you agreed to follow it, and what you were able to find out about the mill. This page is about those decisions.
A product life-cycle assessment is a structured measurement of the environmental impact of one product across the stages of its life: growing or extracting the raw material, spinning and dyeing and sewing it, moving it, wearing and washing it, and whatever happens at the end. Green Story builds them from the orders a brand actually placed and the suppliers who made the garment, and states on every result how much of it was measured and how much estimated.
- Every LCA is answering a question.Before the number
- The functional unit.Decision one
- The system boundary.Decision two
- What each stage actually contributes.Inside the boundary
- Where each number came from.Decision three
- What it will ask of you.The honest answer
- The standards an assessment is held to.The frame
Every LCA is answering a question.
A life-cycle assessment is not a property a product has, in the way that a weight is. It is the answer to a question someone asked, and change the question and the honest answer changes with it. The same t-shirt can carry two very different figures without either being wrong: one counted the washing, the other stopped at the factory gate.
That sounds like a weakness and is in fact the discipline. ISO 14040 opens with goal and scope definition for this reason: you agree what is being measured, per what, and how far, before a single kilogram is counted. A figure quoted without those three things attached cannot be compared with anything, which is how two brands end up arguing about numbers that were never describing the same thing.
So the three decisions below do more work than the arithmetic does. They are worth understanding even if you never run an assessment yourself, because they are what you are agreeing to when you accept a supplier’s number or send one of your own to a retailer.
- Decision one
The functional unit: what you are measuring, per what
Not “a t-shirt”. One 180 gsm cotton jersey t-shirt, delivered to a European warehouse, worn fifty times over two years. The unit is what makes two figures comparable, and it is the thing most often left out.
- Decision two
The system boundary: how far along the life you follow it
Cradle to gate stops when the product leaves the factory. Cradle to grave carries on through distribution, wearing, washing and disposal. Neither is more correct; they answer different questions and they must never be compared with each other.
- Decision three
The data: where each input’s number came from
A meter reading at the mill that made your fabric, and an industry average for the same process, are both legitimate inputs. They are not equally strong, and a result that does not tell you which one it leaned on is hiding its weakest part.
The functional unit.
The functional unit is the job the product does, stated precisely enough that two products doing the same job can be set beside each other. It is the denominator of every figure in the assessment, and getting it wrong invalidates the comparison rather than merely shifting it.
The classic trap in apparel is comparing per item. A polyester jacket and a wool one are not doing the same job if one lasts three winters and the other lasts fifteen, and a per-item comparison quietly rewards the garment that fails sooner. Divide the same impacts by the number of wears the garment actually delivers and the ranking can reverse outright. That is not a trick of arithmetic: durability really is an environmental property, and a functional unit that ignores it is measuring the wrong thing carefully.
Which is why a functional unit worth the name carries a quantity, a quality, a duration and a place: what the product is, what it is made of and to what specification, how long it serves, and which market it was delivered to. When a customer sends you a footprint to match, the first useful question is almost never about the method. It is: per what?
The system boundary.
The boundary is how much of the product’s life the assessment agrees to look at. In textiles the life divides into stages that behave very differently from one another, and where you draw the line decides which of them are allowed to matter.
Cradle to gate is the working boundary for most of what the industry does day to day. It covers fibre, yarn, fabric, wet processing and make-up, and it stops when the finished product leaves the last factory. It is what a supplier can actually evidence, what a retailer’s questionnaire usually asks for, and what a Scope 3 purchased-goods line is built from. Its virtue is that every input inside it belongs to someone who can be asked for a document.
Cradle to grave carries on: distribution, retail, the use phase, and end of life. It is the boundary that consumer-facing claims and most regulatory display schemes require, because it is the only one that describes the product a person actually owns. Its difficulty is that nothing inside the added stages is under your control. How often the garment is washed, at what temperature, whether it is tumble dried, how long it is kept and where it ends up are behaviours, not procurement decisions, and they are modelled on assumptions that must be stated rather than measured.
The practical rule: never compare a cradle-to-gate figure with a cradle-to-grave one, and be precise about which you have been sent. A gate figure that looks impressively low beside a grave figure is not better. It is shorter.
The two boundaries you will be asked for, what each one covers, and the question each is the right answer to.
Raw material, spinning, knitting or weaving, dyeing and finishing, cutting and sewing, and the transport between them. It ends at the factory gate of the last operation.
Use it forSupplier questionnaires, Scope 3 purchased goods and services, eco-design comparisons between two fabrics or two mills, and any figure you need every input of to be evidenced.
Everything above, plus distribution and retail, the use phase (washing, drying, ironing, repair) and end of life, whether that is landfill, incineration, resale or recycling.
Use it forConsumer-facing claims, product passports, display schemes such as France’s environmental cost, and any question about whether a product is actually better to own.
What each stage actually contributes.
Impact in a textile chain is not spread evenly, and the shape of it is stable enough to be worth knowing before you commission anything. It tells you where to spend your data effort, which is the scarcest thing in this work.
Wet processing is usually where the energy is. Dyeing and finishing run hot and wet, and a dye house’s fuel source (coal-fired steam against gas, against grid electricity in a country with a clean grid) moves a garment’s footprint further than most material substitutions do. It is also the stage where the word on the invoice tells you least: “dyeing” covers a dozen processes with a several-fold spread between them.
Fibre matters, but rarely on its own terms. What moves a fibre’s number is usually the farming system, the ginning yield, the transport distance and the grid behind the spinning mill, not the name of the material. This is why fabric-level league tables disagree with each other so often, and why a material swap that looks obviously correct on paper can produce no measurable benefit in a real chain.
And the stages after the gate are not small. For a garment that is washed regularly over several years, the use phase can rival everything that happened before it, and it is governed by consumer behaviour that no brand controls and few assessments measure directly. That is the gap our own research with Northumbria University set out to look at, and the session is below.
- Stage
Raw material
Farming or extraction, ginning, and the first transport. Highly variable by region and system; the dominant lever is usually how the material was grown or recovered rather than what it is called.
- Stage
Yarn and fabric
Spinning, knitting or weaving. Mostly an electricity story, which makes the grid behind the mill (and therefore the country) a first-order input rather than a detail.
- Stage
Wet processing
Dyeing, printing, washing and finishing. Thermal energy, water and chemistry together, and typically the largest single block inside the gate.
- Stage
Make-up and packaging
Cutting, sewing, trims, and the packaging that leaves with it. Modest in energy, significant in waste: offcut rates belong in the assessment rather than in a footnote.
- Stage
Distribution
Freight mode does the work here. Sea against air is not a marginal difference, and the leg that gets forgotten is usually the last one.
- Stage
Use
Washing, drying and ironing over the garment’s life, divided by the wears it delivers. Modelled from behaviour, so the assumptions must be published with the result.
- Stage
End of life
Landfill, incineration, resale, repair or recycling, in the proportions that market actually sends them. The stage where circularity claims are either substantiated or quietly assumed.
Where each number came from.
Every input in an assessment needs a number, and those numbers are not equally strong. A meter reading from the dye house that processed your fabric during the month your order ran is a different class of evidence from a published average for “dyeing, woven, medium shade”, and an assessment that presents both with the same confidence is telling you less than it knows.
Green Story works to a declared order of preference, and the rank of an input travels with the result rather than being discarded once the arithmetic is done. Your own primary data first; our own datasets, built from collection at supplier facilities, second; established third-party life-cycle databases for the background processes nobody collects per order, such as grid electricity and freight; and peer-reviewed literature where a fibre or process is new enough that nothing else exists yet.
An analyst may only move down a tier when the tier above has been tried and cannot be obtained for that specific input: per input, not per product. A single footprint routinely draws on all four, which is exactly why the split is stated on the face of the result instead of being summarised away. The number worth watching over time is not whether estimation was used. It always is. It is whether the measured share is rising season on season.
What it will ask of you.
This is the question everyone actually has, and the answer is smaller than most people fear: a list of your products, however they already exist. A spreadsheet export, an API connection, or a manual list. The first requirement is a product list, not a finished dataset. Assembling the dataset is the work, and it is the work our analysts do.
From there the assessment needs to know what each product is made of and who made it. Bills of material and fabric specifications, the orders that caused the production, and the suppliers those orders went to, tier by tier back through make-up, fabric, yarn and fibre. Most brands know their first tier well and their third barely at all, and that is the normal starting position rather than a failure.
The supplier side then runs on its own. Each supplier gets their own portal and a single queue of requests with deadlines, and our analysts chase the answers. Where a supplier will not or cannot answer, the gap is graded and recorded as a gap. It is never quietly filled with a default and presented to you as collected.
How long it takes is governed by the evidence, not by the calculation. A first assessment moves at the speed the documents come back and the depth the chain has to be traced to; once the chain and the product library exist, further assessments run at scale. Which is why the useful question is rarely how long one assessment takes, and almost always how quickly evidence arrives.
- You provide
Your products
However they already exist: CSV, API or a manual export. This is the only thing needed to begin.
- You provide
Composition and specification
Bills of material, fabric weights and constructions, and the tech pack detail you already hold for production.
- You provide
Orders and suppliers
Which order was made where. Your first tier is enough to start; the tiers behind it are what tracing is for.
- We do
Collection from the chain
Suppliers answer in their own portal, against deadlines, with our analysts chasing them.
- We do
Modelling and review
Boundary, allocation and factor choice set by LCA specialists. This is the step where sound inputs and a wrong model usually meet.
- We do
Stating the gaps
What could not be obtained is graded and named on the result, so you know where the assessment is thin before anyone else finds out.
The standards an assessment is held to.
Life-cycle assessment is a standardised discipline, which is what makes a result something other than an opinion with a decimal point. ISO 14040 and 14044 set the principles and the requirements (goal and scope, inventory, impact assessment, interpretation) and ISO 14067 applies them to the carbon footprint of a product specifically.
In Europe the Product Environmental Footprint method sits on top of that, prescribing more than ISO does: which impact categories, which datasets, which rules for a given product family. It is the method the European display schemes are built on, including France’s environmental cost, and it is why two ISO-compliant assessments can still be incomparable while two PEF assessments of the same product family are meant not to be.
Green Story’s life-cycle work follows ISO 14040/44 and ISO 14067 on the PEF method, and the corporate inventories that product footprints feed follow the GHG Protocol. The frame changes the presentation and the rules of comparison. It does not change the underlying figure.
Everything this page defined.
In the order you met them, in case you came back for one of them rather than for the whole page.
- Functional unit
- The job the product does, stated precisely enough to compare: quantity, quality, duration and market. Every figure in an assessment is divided by it.
- System boundary
- Which life-cycle stages the assessment includes. Two figures with different boundaries are not comparable, however carefully each was made.
- Cradle to gate
- Raw material through to the point the finished product leaves the last factory. The working boundary for supplier data and Scope 3.
- Cradle to grave
- Cradle to gate plus distribution, use and end of life. The boundary consumer-facing claims and display schemes require.
- Primary data
- A value measured in your own chain for your own order (a meter reading, a utility invoice, a production record) rather than taken from a published average.
- Allocation
- How impact is divided when one process yields more than one output, fibre and seed from the same ginning, for instance. The choice is declared, because it moves the answer.
- PCF
- Product carbon footprint: an assessment reporting climate impact alone, in CO₂ equivalent. A full LCA covers water, land and other impact categories as well.
- Impact category
- A dimension of environmental harm: climate change, water use, eutrophication, land use. Reporting one is legitimate; implying it is all of them is not.
The shorter answers live on the FAQ.
Each of these is answered in a paragraph on the FAQ, which is where those answers live. This page is the long version of the same subject.
Hear it from the people who teach it.
Every session below is ours, and all of it opens straight away. Dr Kannan Muthu, who sets the method here, wrote what has become the standard handbook on life-cycle assessment for textiles and clothing; the masterclass is the closest thing to sitting in on that teaching.
 Online Masterclass on Lifecycle AssessmentAn hour on the core principles with our own Chief Sustainability Officer: theory, how assessments are actually conducted, the pitfalls, and what it takes to scale beyond a handful of products. Start here if you only watch one.→
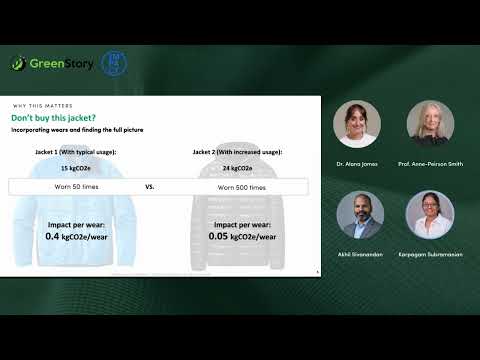 What Really Drives Fashion’s Impact? Use & End-of-Life ExplainedNew research with Northumbria University’s Impact+ programme on the stages past the factory gate: where current LCA approaches have gaps, how consumer behaviour moves a per-wear footprint, and what that means for durability and eco-design.→
 How Life Cycle Assessment (LCA) can help brands navigate sustainabilityDr Muthu’s white paper, which takes the criticism of LCA seriously rather than defending the method (including the Higg Index episode) and sets out how data accuracy is actually held.→
 Assessing your product’s impact: A fireside chat with LCA pioneer Dr MuthuThe conversational version of the same material: what an assessment can and cannot tell you, asked by someone who is allowed to push back.→
 The use and misuse of data and life cycle assessment (LCA) in fashionWhere LCA gets stretched past what it can support, and how to tell when a figure has been.→
 Data-Driven Sustainability: Mastering LCA for ImpactThe operational session: getting from a first assessment to a product library that stays current.→
 How to ensure accurate impact measurement of your products in compliance with anti-greenwashing legislationMeasurement and the claims it is allowed to support, taken together, which is the order the law now requires you to think in.→
 Seed to shelf: impact assessments, innovation and the future of impact data in fashionThe whole chain end to end, from the farm to the shelf, for anyone who wants the shape before the detail.→
An LCA is a model, and a model is an argument about which things matter. It will not tell you whether a garment should have been made, it cannot capture what it does not measure, and a figure carried to three decimal places is claiming a precision that the underlying data does not have. What it does do, done honestly, is make a comparison possible and an assumption visible, and we would rather hand you a result that says plainly which parts of it were estimated than one that reads as certain and cannot survive being asked about.
The same subject from another side.
- Product LCA on the platformWhat this looks like as software: the assessment, the evidence behind each input, and the result you can publish.→
- The data hierarchyThe four source tiers in full, and the rule for when an analyst is allowed to move down one.→
- Tell us where you areTwo questions, and we will point you at what matters for your situation rather than at all of it.→